| 1. | Motivation |
| 2. | Environment |
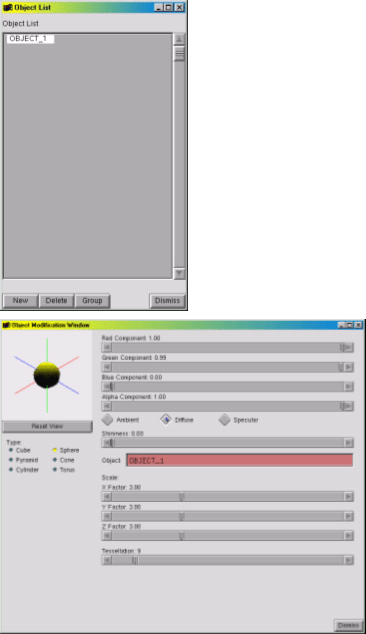
| 3. | Adding Objects - A Simple Way |
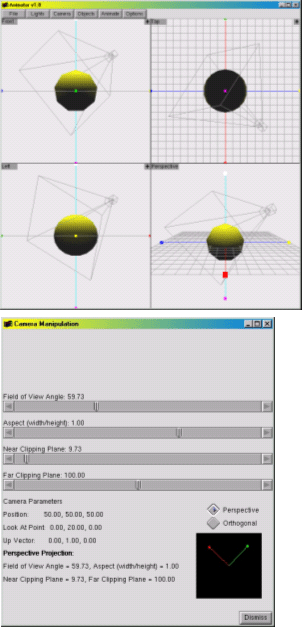
| 4. | The Camera |
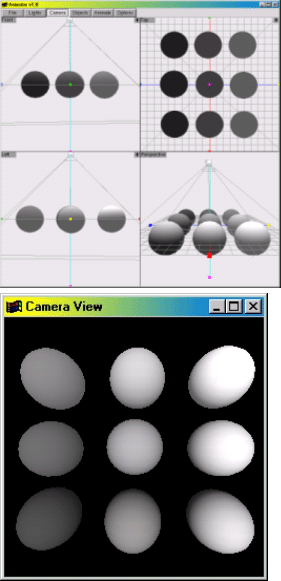
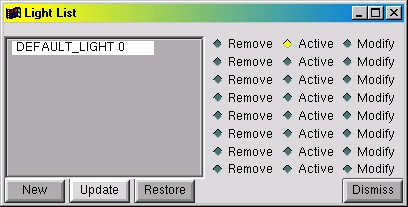
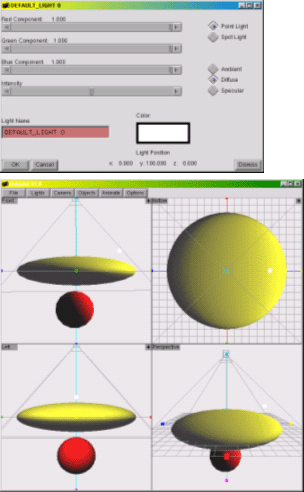
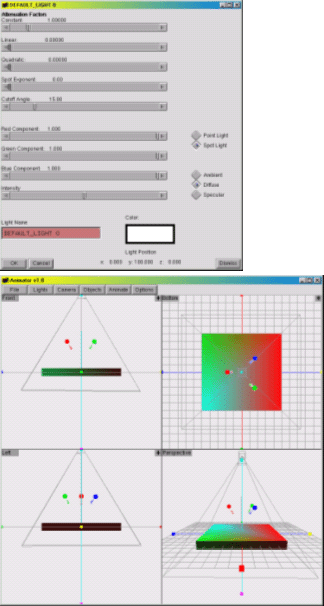
| 5. | Lights, Please! |
| 6. | Basic Animation |
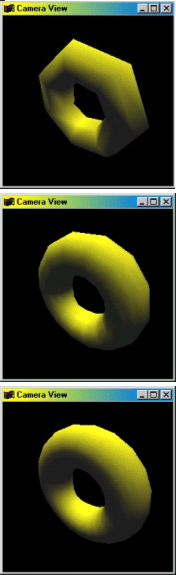
| 7. | Global Illumination Models |
| 8. | Future Work |
| 9. | Conclusions |
| 10. | Acknowledgment |
| 11. | References |
Teaching and Learning Computer Graphics Made Easy with GraphicsMentor
Ching-Kuang Shene, Michigan Technological University
Abstract
The programming approach is perhaps the most popular approach in teaching
introduction to computer graphics courses. However, it suffers a significant
drawback. Students must learn a lot before they can write their first
program. Worse, they may not even know if their images are correctly produced.
Additionally, the programming approach depends on an API (e.g., OpenGL)
that may only support local illumination models. Consequently, students
will miss important topics that are associated with global illumination
models. To overcome these problems, a pedagogical system GraphicsMentor
was developed. GraphicsMentor allows students to modify
parameters of the camera, objects, and light sources interactively, and
visualize the rendered result on-the-fly. Moreover, it is able to export
a scene to POV-Ray, a very popular ray tracing system, for rendering.
GraphicsMentor is being extended to include photon mapping
and radiosity. In this way, with the help of GraphicsMentor,
a student should be able to grasp the fundamentals of computer graphics
quickly and easily in a learning-by-doing way.
1. Motivation
The programming approach is perhaps the most popular approach
in teaching introduction to computer graphics courses. However, the programming
approach suffers a significant drawback in that students must learn a
lot before they can write their first program. Even with tools designed
by instructors helping students start programming early, students still
face the challenge that in many situations they do not know if the generated
results are correct. This is mainly due to the fact that to generate correct
and good-looking images students must know many topics that can only be
covered near the end of a semester. Consequently, their high hopes fade
away quickly. Hoare once said, “You can't teach beginning programmers
top-down design because they don't know which way is up.” Similarly,
we cannot teach graphics programming to beginners because they do not
know if their programs function properly before knowing what the anticipated
effect would be. Thus, “I do and I understand'” (i.e.,
the programming approach) is not enough for learning graphics, and we
should add “I see and I remember'' for a beginner to recognize what
is correct and what is not. For example, the author’s experience
shows that many students have difficulties in camera setup and the use
of light sources. Frequently, a blank image is generated because the camera
points to a wrong direction, or the scene is not illuminated properly
because of incorrect positions of light sources. Moreover, they do not
know if it is their fault when Mach bands appear in their images. Additionally,
since graphics is not a prerequisite for our Introduction to Computing
with Geometry course, we must cover sufficient graphics background
so that students can write programs to solve geometric problems in curve
and surface design (Lowther and Shene, 2001). Previously, we used ray
tracing (Shene, 2002) because it is easy to learn and use; however, ray
tracing only covers global illumination models and does not involve a
programming component. We also believe that students must be exposed to
local illumination models on which most API’s are based.
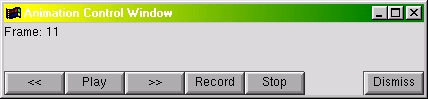
To address these and other problems, we developed GraphicsMentor, a pedagogical tool, written in C/C++, OpenGL and GLUT, for Linux, SGI IRIX, Sun Solaris, and Windows systems. It allows a student to alter virtually every parameter of the camera, light source and object material property, and visualize the result on-the-fly. A limited keyframe animation capability is also available. Because of its flexibility and interactive nature, GraphicsMentor can help students learn graphics fundamentals easily and quickly. Hence, GraphicsMentor may be used in a computer-equipped classroom or in a lab for students to practice and experiment with various concepts and for an instructor to demonstrate the effect of changing graphics parameters.
There are three major reasons for us to develop GraphicsMentor even though there are many high power systems available (e.g., trueSpace, LightWave 3D, 3D Studio Max and Maya) that support all features of GraphicsMentor. The first and the most important reason is cost. GraphicsMentor is designed to be pedagogical and is free for students and instructors to run on popular systems with minimal hardware requirement. Commercial professional systems cost a few hundred to several thousand dollars per copy and, as a result, they are not very cost effective. Worse, many of them can only function properly with a hardware lock in place, and the cost for a replacement if the lock is stolen is as high as purchasing a new copy. Second, due to its pedagogical nature, the use of GraphicsMentor is straightforward, whereas commercial professional systems usually have very steep learning curve because of their power and complex menu systems. Third, allowing students to redesign and/or modify various components of GraphicsMentor for supporting graphics programming has been one of our major goals. This support is similar to many pedagogical tools that are being used in other courses (e.g., Nachos for operating systems). However, such programming support is virtually impossible with commercial professional systems.
This paper briefly reviews GraphicsMentor and presents its possible classroom uses. The interested readers may refer to (Lowther and Shene, 2000; Lowther and Shene, 2001; Shene 2002) for a detailed discussion of related work.
2. The Environment
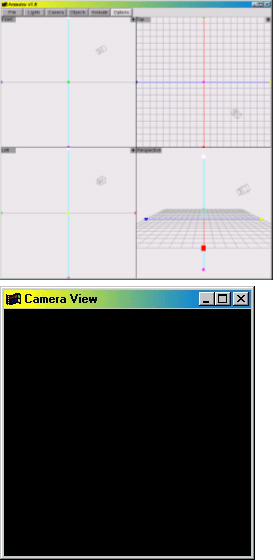
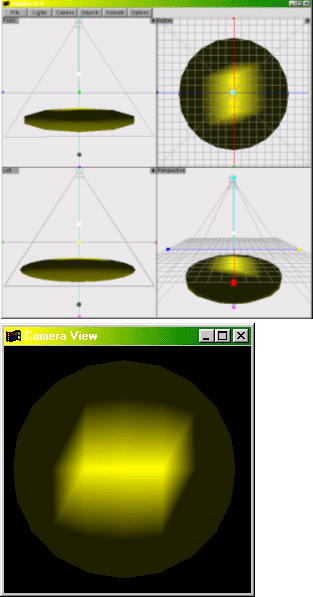
When GraphicsMentor starts, it displays the Canvas
window and the Camera
View window. The Canvas
window is further divided into four subwindows (Figure 1(a)). The upper-left,
upper-right, lower-left and lower-right subwindows display the front,
top, left, and world views of the scene, respectively. The first three
can be switched to the back, bottom, and right views by clicking on the
button in the upper-left corner of each subwindow. Initially, the scene
only contains a camera and a light source above the coordinate origin
as shown by the camera icon and a white dot in the subwindows. The Canvas
window also has a number of menu buttons for activating the camera, lights,
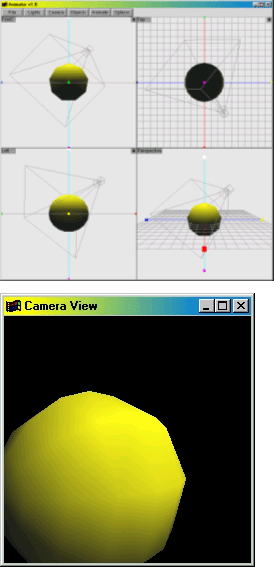
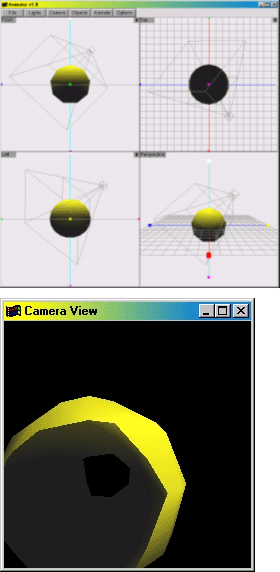
objects and animation. The Camera
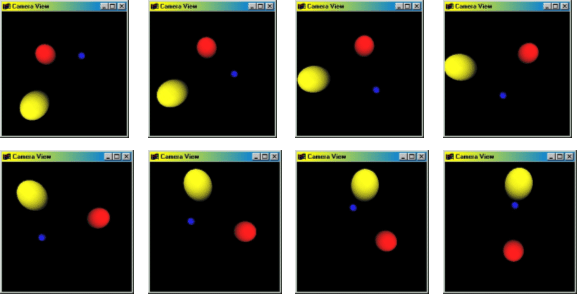
View window displays what the camera sees (Figure 1(b)).
Since nothing is in the scene initially, it shows the background color.
With this setup, a student will have no difficulty in placing objects
into the scene, manipulating the position of the camera, and changing
the position, color, and type of light sources. Hence, the most challenging
initial step of creating and viewing a scene is made much easier.