IMEJ main Wake Forest University Homepage Search articles Archived volumes Table of Content of this issue
1. Introduction
2. The Algorithms in Action Framework
3. Recursion
4. Code Tracing of Recursive Calls
5. Recursive Manipulation of Data Items within an Existing Linear Data Structure
6. Recursive Navigation through a Linear Data Structure
7. Navigation and Data Manipulation in Non-linear Data Structures
8. Navigation Using Non-Tail Recursive Algorithms
9. Recursive Insertion into a Data Structure
10. Evaluation
11. Recursive, Iterative or Both?
12. Conclusion
13. Availability
14. Acknowledgment
15. References

Printer friendly version


Animating Recursive Algorithms
Linda Stern, The University of Melbourne
Lee Naish, The University of Melbourne

Abstract
Designing visual representations for recursive algorithms has been addressed within a pedagogically-oriented framework for animating algorithms. We present a classification for choosing the kind of visual representation that is most helpful to students. The classification is based on the way the algorithm navigates through a data structure and manipulates data items within a data structure, and suggest strategies for visual representation that work within the categories of this classification. Further opportunities for tailoring representation derive from the shape of the data structure and particular forms of recursion, such as tail recursion. While there may be no single, general way to represent recursive algorithms, our classification is a
useful guide to picking an appropriate strategy for use when animating recursive algorithms for teaching purposes.

1. Introduction
The Algorithms in Action (AIA) project [14] uses multimedia animations of algorithms as a pedagogical tool to help students learn. Our target group of students is studying a second-year core curriculum subject on data structures and algorithms, where the concentration is on searching and sorting algorithms. The students are familiar with the concept of recursion, but have not yet been exposed to any but the simplest of algorithms.

Although several algorithm animations are available, especially for the simpler algorithms [4], few satisfied our need for pedagogically oriented animation. Notable exceptions are Gloor's CD companion [7] to a text on algorithms [5] and the collaborative active textbooks of Marc Brown [2, 3], neither of which fit well with our syllabus and choice of textbook [11].

Our aim in developing AIA was to find a general approach to presenting and animating algorithms and to implement a framework that could be used as the basis for presenting specific algorithms. The expectation was that interactive visual presentation would help students develop both an overall conceptual idea of how each algorithm works and a more detailed procedural understanding.

2. The Algorithms in Action Framework
The AIA framework consists of animation, pseudocode, and textual explanation, all coordinated, as previously reported [15]. A cursor traces the execution of the algorithm through pseudocode, while the animation displays a conceptual representation of each step. Students control the level of detail being displayed by expanding or contracting lines of pseudocode. At higher levels of abstraction the animation helps students to grasp the overall concept of an algorithm, while the more detailed views help them understand the workings of the algorithm at a procedural level. The level of detail in the animation, in the explanation, and in the pseudocode expand and contract synchronously.

About the authors...


3. Recursion
Representing recursive algorithms in ways that will be helpful to students has proven to be more challenging than designing representations for iterative algorithms. While initially we sought a general approach to the problem of displaying recursive algorithm, in practice, we found that the choice of most suitable representation depended on the particular algorithm being displayed.

The most appropriate visual representation for recursive algorithms was correlated with a classification based on how the algorithm navigates through and manipulates the data items within the data structure [13]. In this classification, one category of algorithms consists of those that traverse a static data structure (e.g. search), another category contains algorithms that manipulate items within an existing data structure (e.g. sort), and a third category contains algorithms that build a data structure (e.g. insert). Within these categories, it was sometimes useful to further subdivide based on additional criteria, such as tail recursiveness and data structure shape.


4. Code Tracing of Recursive Calls
In AIA, only one copy of the recursive function is shown in the pseudocode. As a recursive call is made, the pseudocode tracing restarts at the top of the function. Visual clues assist with clarity here, and most of our second-year students understand that when the pseudocode cursor jumps from the recursive call within the function to the top of the same function, this represents a new function call. This approach might not be suitable for beginning programmers, where it may be useful to pop up a new window for each recursive call [16].


5. Recursive Manipulation of Data Items within an Existing Linear Data Structure
In recursive sorting algorithms, such as quicksort and merge sort, the starting point is an array or linked list containing the data items to be sorted. The data structures are linear, and the algorithms use the classical divide-and-conquer approach, where the algorithm makes a number of recursive function calls to smaller and smaller parts of the data structure. During each recursive call, some data items are rearranged. For example, in quicksort, each function call partitions the data such that all items before a designated "pivot" element are smaller than (or equal to) the pivot, and all items after are larger (or equal). Two recursive calls are then made, one to the part of the array with the smaller elements, and another to the part of the array with the larger elements. The student's task is to learn what happens during each recursive call and to understand how the progression of recursive calls moves the sorting process through the data structure.

For these algorithms, where data items within an existing linear data structure are manipulated without the data structure changing its size or shape, we represent each recursive call by a horizontal line under the sequence of data items referred to in the recursive call (Figure 1). The value of each data item is represented by a vertical bar, similar to the representation used in the seminal algorithm animation video, "Sorting out Sorting" [1]. Our use of horizontal bars to underline the segment of the data structure being manipulated during the recursive call bears a similarity to the design used by Dershem and Brummond [6]. Additionally, different shades of color distinguish between the currently active call, calls on the function stack, and completed calls.


Figure 1. Quicksort animation, showing recursive calls. The current recursive call is sorting the elements 25, 35, 30, with 30 as the pivot (shown by the box). Elements up to 20 have already been sorted, while elements from 40 onwards are waiting for a call on the stack to be done.

Quicksort animation applet.


6. Recursive Navigation through a Linear Data Structure
Searching through a dictionary abstract data type entails navigating through a data structure, searching for a data item with a particular key. Initially nothing is known about the location of the key. As the search progresses the subset of possible locations is narrowed down.

Where the data structure is linear, navigation can be represented by horizontal lines under the data items referred to in the recursive call. This is similar to the representation used for quicksort, except that the search narrows in scope as it progresses (Figure 2), since there is only one recursive call, instead of the two recursive calls made by each invocation of quicksort.

This representation can also be useful for an equivalent iterative coding as it gives the history of the search at a single glance, but is less natural.


Figure 2. Binary search, showing 3 recursive calls. The horizontal lines under the data structure show subarrays for successive recursive calls.

7. Navigation and Data Manipulation in Non-linear Data Structures
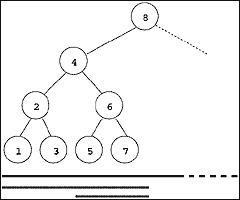
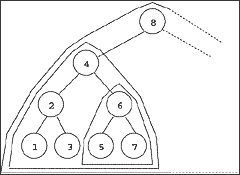
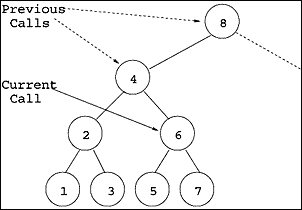
Data structures for search often have a nonlinear tree structure, which makes visualizing the current subset of the data more challenging. For a tree structure, there are several different ways in which the current subtree can be shown. Given some constraints on the tree layout, a horizontal bar similar to the horizontal bars used in quicksort can underline the leaves of the current subtree (Figure 3a). Alternatively, a modified approach can enclose subtrees involved in recursive calls in polygons (Figure 3b). Less abstractly, a pointer to the root of the subtree can be shown (Figure 3c).

The choice of representation is influenced by the students' background. First year students might find it easiest to understand the algorithm where the entire subtree is outlined. Later year students would generally be able to understand the significance of a pointer to the root of the subtree. The pointer representation has the advantage of being closest to the recursive code, and students might find this representation assists them in following the pseudocode closely. The pointer representation, alone or in combination with other representations, may help students make the link between the algorithm code and progression through the data structure, conceptualizing the idea that the subtree whose root is being pointed to consists of all the data still under consideration. Horizontal bars under the data structure might be useful in cases where the data structure is complicated and an objective is to reduce clutter on the screen, and can highlight the similarities between different algorithms, such as searching a (balanced) binary search tree (Figure 3a) and binary search in an array containing the inorder traversal of the same tree (Figure 2).


(a)
 
(b)

(c)

Figure 3. Recursive binary search tree, showing three different ways to display the part of the data involved in the current recursive call:
(a) The leaves, or outer extent, of the current tree are underlined;
(b) Polygons are used to outline the subtree under investigation, with larger triangles showing the history of previous recursive calls;
(c) A pointer to the root of the subtree corresponding to the current recursive call is shown (solid line arrow); optionally, a history of recursive calls can be kept (dotted line arrows).


8. Navigation Using Non-Tail Recursive Algorithms
Where code is tail recursive, the currently active function call narrows the search one step, while the rest of the searching is done in successive recursive calls. The tail recursive algorithm is very similar to an iterative while loop. Visual representation for both recursive and iterative codings must indicate which part of the data structure is under investigation. For a recursive implementation, it is natural for the display to indicate multiple subsets of the data, getting smaller as the search progresses through multiple recursive calls.

When the code is not tail recursive, there is work to be done upon returning from the recursive call. The location of the recursive call within the code is important because it determines what work is to be done upon return from the call. The pedagogical challenge here is to help students keep track of the point in the calling function where the recursive call is made, as well as how the navigation is progressing through the data structure.

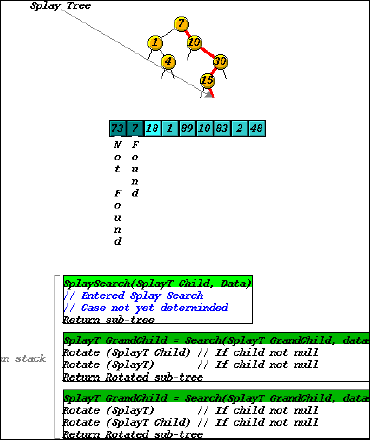
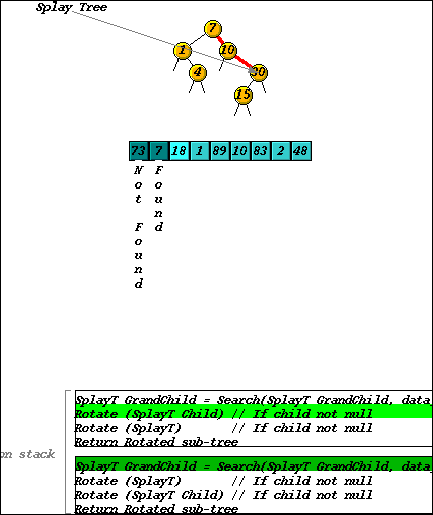
For example, when navigating through a splay tree [11] "rotations" are performed after the return from the recursive call. Rotations are local operations on a small portion of the tree, intended to improve the overall balance of the tree. Because the place of the rotations within the algorithm may not be immediately obvious to a student just learning the algorithm, we supplement the main animation display with an abbreviated function stack (Figure 4). The aim of showing the function stack is to track the progress through the calling function, and to show the work still to be done after return from the recursive call. We are, in effect, combining two types of animation: animating the result of the program, in the tree, and simultaneously animating the state of the program in the function stack [8], to help students make the mental link between the two processes.


(a)


(b)

Figure 4.
Splay tree search showing stack.
In (a) the stack contains three function calls. The third (top) call has been called from the first line in the second call (highlighted).
In (b), the third call has returned, and the second call is performing the rotation specified in its second line (now highlighted).

Splay tree applet.


9. Recursive Insertion into a Data Structure
Unlike navigation, which works on an existing data structure, insertion of items into a data structure involves major changes in the size and possibly the shape of the data structure. Accurate visual representation of recursive insertion requires depicting changes in the data structure both during the growth phase, when the correct insertion point is sought and recursive calls are added to the function stack, and during the shrinking phase, when the recursive calls return, the function stack shrinks, and the appropriate links within the data structure are made.

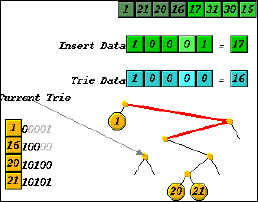
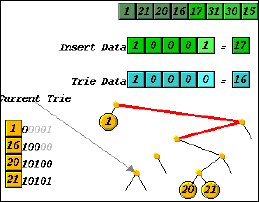
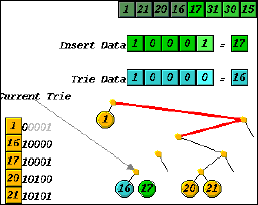
For relatively uncomplicated algorithms, representation can be straightforward. Taking the radix search trie as an example, insertion involves creation of one new external node and possibly one or more internal nodes, which must all be linked into the trie. In animating insertion here, we depict the growth stage of the algorithm, where decisions about the path and nodes are made, by tracing the path to the insertion point, leaving gaps for the links, which are still to be made. (Figure 5). During the shrinking phase of the insertion algorithm, the animation shows the links forming as the recursive calls return. Since the eventual shape of the subtree after insertion of the new data is not known at the time of the growth phase, the pointer representation is convenient.


(a)

(b)


(c)


Figure 5.
Insertion into radix trie. New nodes are formed as recursive calls are being made, but are not linked to the rest of the trie. The links will be made as the recursive calls return.


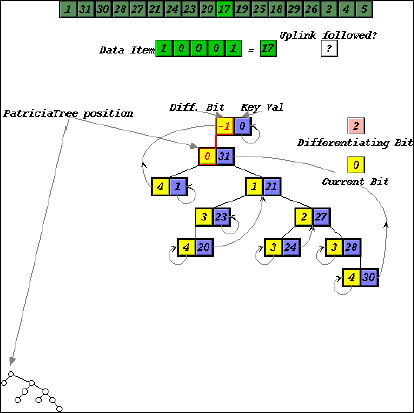
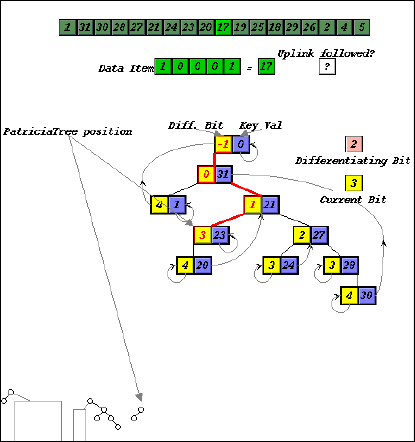
For more complicated algorithms, we supplement the main part of the animation with a thumbnail sketch that abstracts the data structure and indicates the part of the data structure referred to in the recursive call. For example, the main animation in our representation of a Patricia trie [11] shows all the details necessary to follow the workings of the algorithms, such as keys and upward links. Thumbnail sketches capture the essence, showing only nodes and links in the subtree currently being searched, without detail. The region to be searched by future recursive call(s) is represented by an large blank space (Figure 6). Thumbnail sketches are used in both the growth and shrinking phases of the algorithm, and are visually linked to the main animation. Over the course of the algorithm the thumbnail sketches allow us to build up a history of recursive calls, which helps students keep track of the overall progress of the recursive navigation.


(a)


(b)


(c)


Figure 6. Insertion into Patricia tree, with thumbnail sketches as navigation aids.

Patricia tree applet.


10. Evaluation
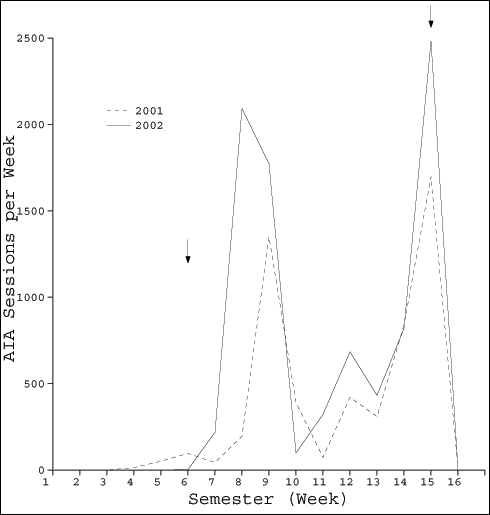
Our evaluation of the effectiveness of AIA has so far concentrated on the ways in which students find the tool useful in their learning. To date we have not specifically evaluated how students learn recursive algorithms, as distinct from and how they learn iterative algorithms. Data has been derived from diverse sources, including detailed usage logs, questionnaires, controlled observation, and focus groups. Our observations indicate that students believe that the tool allows them to learn better and faster. Particularly telling was the automated logging, which showed significant usage over the semester -- an average of around 30 sessions per student in the most recent semester (Figure 7). There was an initial peak when the system was first introduced to the students and, quite significantly, a large peak before the examination. The two troughs in the graphs corresponded to project deadline, i.e. students are otherwise occupied. In the week prior to the examination alone, there was an average of 8 sessions per student. Students' perceptions that the tool helped them learn was apparently translated into the action of using the tool for at least part of their study time.


Figure 7. Usage of Algorithms in Action. Logging was done automatically during semester 1, 2001 and and semester 1, 2002. Numbers along the x-axis indicate teaching weeks, 1 being the first week of the semester. The y-axis shows the number of student sessions with AIA initiated during that week. Students can use multiple modules within a single session. Arrows indicate when Algorithms in Action was introduced to the class (week 5), and the week of the examination (week 15). Class size was approximately 300 students in both years..


Our initial intention was for students to use AIA in a top-down manner, first viewing algorithms at a more abstract level then increasing the level of detail (stepwise refinement). However, controlled observation revealed that some students used AIA in a bottom-up way, first expanding the pseudocode to give maximum detail then progressively contracting it as parts were understood. Following this observation, we concluded that students will use the tool according to their personal preferences and learning styles. We included a feature that allows the algorithm's pseudocode to be completely expanded with one mouse click, to facilitate bottom-up learning.

Variations were also seen in the different use that students made of the textual explanations. During controlled observation, little use was made of the text, yet the detailed logging shows that some students make heavy use of the explanations. This may be due to different student preferences, but another possibility is that students are more reluctant to take the time to read text while being observed. Research of others suggests that textual explanations are essential for effective learning in algorithm animation systems [12, 9].

To date we have not performed specific evaluation of the ways recursion is visualized in AIA. Based on our more general evaluation, it seems likely that looking in depth at how students use the tool to learn recursive algorithms will reflect the variety of students' preferences and will also suggest further ways in which we can enhance the animation framework to support different styles of learning.


11. Recursive, Iterative or Both?
Many algorithms can be implemented either recursively or iteratively. Because teachers and books generally show students only one implementation, the distinction between the algorithm at a very abstract level and its implementation is sometimes lost. We have speculated that students may find it helpful to look at the iterative version during the initial stages of learning an algorithm, then progress to the recursive version, which generally requires more abstract thinking. In this section we suggest a way in which stepwise refinement can be used to merge recursive and iterative versions of algorithms to aid understanding. We hope to implement and evaluate this idea in the future.

At higher levels of abstraction, with the pseudocode contracted, it is possible to describe many algorithms in an iterative style, even when they may be coded recursively. Lower levels, with more detail, can reveal whether recursion or an iterative looping construct is used. Combining multiple implementations at the highest levels would emphasize to the students that recursion and iteration are merely implementation strategies, a concept that students often miss.

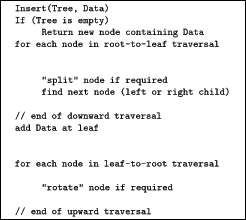
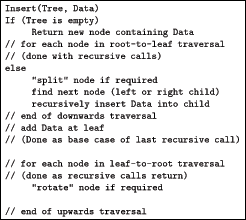
As an example, we show an algorithm for red-black tree insertion. Red-black trees are a kind of balanced binary search tree. The insertion algorithm performs rotations, and also "splitting" operations, which manipulate data and determine what rotations are performed. Iterative insertion algorithms perform splitting and rotation as the tree is traversed from root to the leaf, where the data is eventually inserted [10], and can trivially be recoded as a tail recursive implementation, with the operations performed just before the recursive call. There are also left-recursive algorithms, where splitting and rotation are performed after the recursive calls return - effectively, as the tree is traversed from leaf back to root. Yet another alternative is middle-recursive [11], where splitting is performed during the traversal down to a leaf and rotation is performed during the upward traversal.

Figure 8a shows the algorithm pseudocode at a high level in an iterative style. Figure 8b gives a lower level, or expanded, view. The two for loops have been expanded to reveal that the code is actually middle-recursive. The pseudocode expansion also shows that adding data at a leaf is done via the previous recursive call. By emphasising the common elements between different algorithm variations, we hope the students will gain a deeper understanding of algorithms and the variety of ways they can be implemented.


(a)


(b)


Figure 8. Red-black tree insertion:
(a)
high level pseudocode, iterative;
(b)
lower level pseudocode, recursive implementation, showing relationship to iterative approach.


12. Conclusion
While designing animations to help elucidate recursive algorithms to students, we found that some visual representations were more helpful than others. We noticed a correlation between the kind of visual representation that is most effective and the way data items are being manipulated in the data structure. We group the algorithms we have animated into three categories: those that navigate through an existing data structure; those that manipulate data items within a data structure; and those that insert data items into a data structure. Typically, a particular visual representation works well for different algorithms within one of these categories. Further subdivisions into the type of data structure, e.g. linear or non-linear, and the type of recursion, e.g. tail-recursive vs. non-tail-recursive, are useful in some instances. The choice among alternatives is sometimes dictated by the level of the students and the pedagogical aims. Given the multiplicity of situations and the multiplicity of learning styles, we suggest that there is no single "best" visual representation fo recursive algorithms.


13. Availability
Demonstration modules are available at http://www.cs.mu.oz.au/aia. Further modules are available for teaching purposes, on request.

An external link to www.cs.mu.oz.au/aia


14. Acknowledgments
We would like to thank the Teaching and Learning (Multimedia Education Technologies) Committee of The University of Melbourne for their generous financial support. We wish to thank Ka-Chi Cheung, Andrew Graham, and Tim Witham for programming, Vic Ciesielski for assistance with the figures, and numerous anonymous students for their feedback on modules under development.


15. References
[1] Baecker, R. Sorting Out Sorting. University of Toronto, Morgan Kaufmann, 1981.

[2] Brown, M., Najork, M., and Raisamo, R. A Java-based implementation of collaborative active textbooks. In VL97: Proceedings of the IEEE International Symposium on Visual Languages (1997), pp. 372-379.

[3] Brown, M. H., and Najork, M. A. Collaborative active textbooks: A web-based algorithm animation system for an electronic classroom. SRC Research Report, Systems Research Center (1996).

[4] Brummond, P. The complete collection of algorithm animations. Last accessed at URL http://www.cs.hope.edu/~alganim/ccaa on 4 September 2001.

[5] Cormen, T., Leiserson, C., and Rivest, R. Introduction to Algorithms. MIT Press, 1990.

[6] Dershem, H., and Brummond, P. Tools for web-based sorting animation. SIGCSE Bulletin 30: Proceedings of the 29th SIGCSE Technical Symposium on Computer Science Education, 1 (1998), 222-226.

[7] Gloor, P., Dynes, S., and Lee, I. Animated algorithms: A hypermedia environment for "Introduction to Algorithms", MIT Press, 1993. ISBN 0-262-57096-3.

[8] Kann, C., Lindeman, R. W., and Heller, R. Integrating algorithm animation into a learning environment. Computers Educ. 28 (1997), 223-228.

[9] Naps, T., Eagan, J., and Norton, L. JAHVÉ - an environment to actively engage students in web-based algorithm visualization. SIGCSE Bull. 32 (2000), 109-113.

[10] Sedgewick, R. Algorithms in C, 2nd ed. Addison-Wesley, 1990.

[11] Sedgewick, R. Algorithms in C, Parts 1-4, 3rd ed. Addison-Wesley, 1998.

[12] Stasko, J., Badre, A., and Lewis, C. Do algorithm animations assist learning? an empirical study and analysis. In Proceedings of the INTERCHI '93 Conference on Human Factors in Computing Systems (Amsterdam, 1993), pp. 61-66.

[13] Stern, L., and Naish, L. Visual representations for recursive algorithms. In Proceedings of the 33rd SIGCSE Technical Symposium on Computer Science Education (Cincinnati, 2002), pp. 196-200.

[14] Stern, L., Naish, L., and Sondergaard, H. Algorithms in action. http://www.cs.mu.oz.au/aia.

[15] Stern, L., Søndergaard, H., and Naish, L. A strategy for managing content complexity in algorithm animation. In ITiCSE99: Proceedings of the Fourth Annual SIGCSE/SIGCUE Conference on Innovation and Technology in Computer Science Education (1999), pp. 127-130.

[16] Wilcocks, D., and Sanders, I. Animating recursion as an aid to instruction. Computers Educ. 23 (1994), 221-226.


********** End of Document **********


MEJ multimedia team member assigned to this paper Yue-Ling Wong